How Accurate Are Recipe Nutrition Calculators?
We fed 20 NIH recipes with government-printed calorie panels to two calculators. One was within 10% on 1 recipe, the other on 13. Here is why.
A recipe nutrition calculator is only as accurate as the grams it assigns to each ingredient line, and some of them get that badly wrong. We ran 20 recipes from two NIH cookbooks, each with a government-printed per-serving panel, through two calculators. The Verywell Fit analyzer landed within 10% of the printed calories on 1 recipe out of 20. RecipeClip's calculator landed within 10% on 13. Neither is a lab, and ours has its own bad misses, which are listed below.
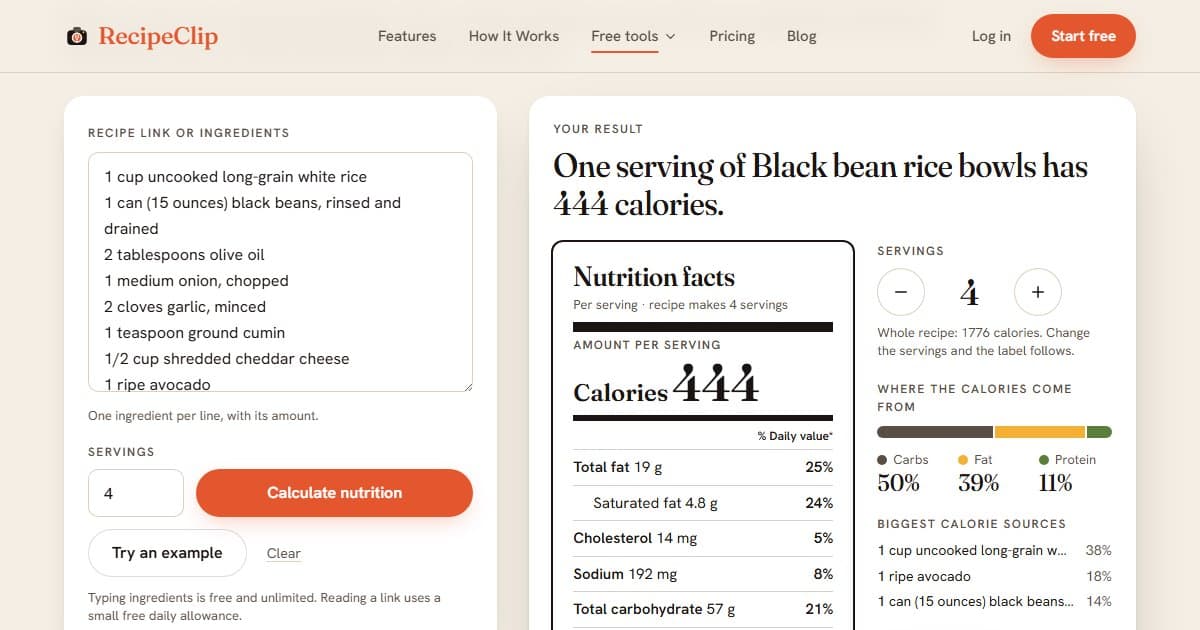
The clearest single example is a tomato soup. The NIH panel prints 94 calories per serving. The Verywell Fit analyzer returned 193, more than double, from the exact ingredient text we pasted into both tools. Ours returned 79, which is 16% low and also outside our 10% band. Both numbers are wrong, but only one of them is wrong by a factor of two.
Here is how we tested, the full results, the three ways calculators fail, and a two-minute check you can run on any result.
How we tested
The truth comes from two US National Heart, Lung, and Blood Institute cookbooks, because both print a nutrition panel for every recipe and neither is a food blog's auto-generated number.
- Heart Healthy Home Cooking, African American Style (NIH 08-3792, 2008) supplied 8 recipes. Its title page says the recipes were analyzed with the Nutrition Data System for Research, 2005, a research-grade analysis tool.
- Keep the Beat Recipes: Deliciously Healthy Family Meals (NIH 10-7531, 2010) supplied 12 recipes. It prints a government panel but does not name the software, so we treat those 12 as slightly weaker evidence.
We picked 20 recipes covering breakfasts, a soup, salads, meat mains, a pasta main, cornbread, desserts and sides. Serving counts run from 3 to 12. No recipe in either book makes 1 or 2 servings, so that range is not covered.
We threw out any candidate whose printed numbers we could not reproduce within about 20% with a hand estimate from USDA values. That removed at least ten recipes, among them a pork chop recipe where the amount of coating that sticks is not stated, a poached salmon where the species is not stated, and a chicken recipe where the marinade is discarded. A panel built on an unknowable assumption cannot grade anyone.
What each tool received:
- The ingredient lines exactly as the cookbook prints them, with unit abbreviations spelled out ("tablespoon" for "Tbsp") and nothing else changed.
- The printed serving count.
- No recipe title and no link. Several of these recipes are published on the NHLBI site with their answers, and we did not want any tool recalling a number from a name.
How we scored it:
- For each nutrient, error is the distance from the printed value divided by the printed value, capped at 100%. Small floors (20 calories, 3 g protein, 3 g fat, 5 g carbs) stop a printed 0 g fat from making every answer infinitely wrong.
- Each recipe's score is the average error across calories, protein, fat and carbs. A tool's score is the average across the 20 recipes.
- One run per recipe from the current build. No reruns to pick a better answer.
- The scorer and the answer key were frozen and hash-checked before our tool's run was scored.
Verywell Fit's tool flags some lines as "Ingredient Not Found. Please Edit." For those, we did what a patient user would: opened the editor once, picked the closest plain food by a fixed rule, and typed the amount. 25 lines across 15 recipes needed this. We never touched a line it had matched on its own, even when the match looked wrong, because a user who sees a finished label has no reason to doubt it. We ran it on October 15, 2026, so its behavior may have changed since.
You can repeat any of this. Pick a recipe from either book, paste only the ingredient lines and the servings count into a calculator, and compare against the printed panel.
The results
| Measure | RecipeClip | Verywell Fit |
|---|---|---|
| Calories within 10% of printed | 13 of 20 | 1 of 20 |
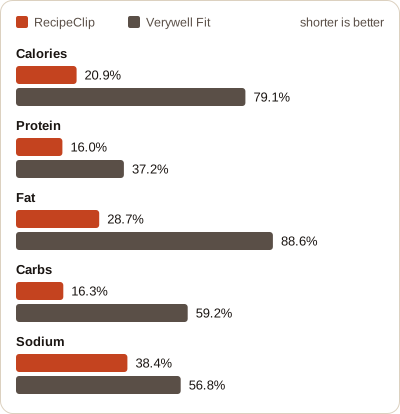
| Mean calorie error | 20.9% | 79.1% |
| Mean protein error | 16.0% | 37.2% |
| Mean fat error | 28.7% | 88.6% |
| Mean carb error | 16.3% | 59.2% |
| Mean sodium error | 38.4% | 56.8% |
| Recipes off by more than 50% on calories | 3 | 17 |
| Median calorie error | 9.2% | 106.5% |
Mean error against the printed panel, by nutrient. A shorter bar is better.
Per recipe, with calories per serving. The percentage is how far each tool was from the printed number. The list is numbered 1 to 20, and the text below refers to recipes by those numbers.
- Oatmeal Pecan Waffles, printed 340: RecipeClip 353 (+4%), Verywell Fit 795 (+134%).
- Baked French Toast Fritters with Apples and Bananas, printed 332: RecipeClip 362 (+9%), Verywell Fit 984 (+196%).
- Spinach and Corn Pancakes, printed 227: RecipeClip 211 (-7%), Verywell Fit 840 (+270%).
- Zesty Tomato Soup, printed 94: RecipeClip 79 (-16%), Verywell Fit 193 (+105%).
- Tuna and Avocado Cobb Salad, printed 224: RecipeClip 234 (+4%), Verywell Fit 465 (+108%).
- Wow-y Maui Pasta Salad, printed 273: RecipeClip 218 (-20%), Verywell Fit 284 (+4%).
- Savory Potato Salad, printed 98: RecipeClip 105 (+7%), Verywell Fit 365 (+272%).
- Autumn Salad, printed 138: RecipeClip 128 (-7%), Verywell Fit 100 (-28%).
- Garden Turkey Meatloaf, printed 180: RecipeClip 355 (+97%), Verywell Fit 583 (+224%).
- Shepherd's Pie, printed 336: RecipeClip 368 (+10%), Verywell Fit 508 (+51%).
- Baked Pork Chops with Apple Cranberry Sauce, printed 232: RecipeClip 240 (+3%), Verywell Fit 430 (+85%).
- Jumpin' Jambalaya, printed 250: RecipeClip 299 (+20%), Verywell Fit 405 (+62%).
- Pasta Primavera, printed 319: RecipeClip 535 (+68%), Verywell Fit 529 (+66%).
- Good-for-You Cornbread, printed 178: RecipeClip 170 (-4%), Verywell Fit 224 (+26%).
- 1-2-3 Peach Cobbler, printed 271: RecipeClip 241 (-11%), Verywell Fit 463 (+71%).
- Southern Banana Pudding, printed 143: RecipeClip 490 (+243%), Verywell Fit 1,481 (+936%).
- Summer Breeze Smoothie, printed 121: RecipeClip 129 (+7%), Verywell Fit 230 (+90%).
- Smothered Greens, printed 80: RecipeClip 84 (+5%), Verywell Fit 265 (+231%).
- Super Quick Chunky Tomato Sauce, printed 31: RecipeClip 28 (-10%), Verywell Fit 171 (+452%).
- Peanut Butter Hummus with Pita Chips, printed 235: RecipeClip 257 (+9%), Verywell Fit 1,229 (+423%).
Verywell Fit was closer on calories on two recipes (6 and 13). RecipeClip was closer on the other 18. Notice that the errors are mostly one-directional: the Verywell Fit analyzer came back too high on 19 of 20 recipes.
Two cautions about reading this. First, 20 recipes from heart-healthy cookbooks is a small, specific set, so do not treat 13 of 20 as a general accuracy rate. Second, the printed panels carry their own noise. Our own hand checks of the answer key differed from the printed panels by up to 18%, so a 10% band is already close to the measurement error of the key itself.
Failure 1: the wrong database match, or the wrong grams
Every calculator does two jobs per line: find the food, then work out how many grams you used. A wrong answer on either one flows straight into the totals.
The biggest failure we saw was on the second job. On the day we tested, the Verywell Fit analyzer's server booked each line it matched on its own as quantity times 100 grams, whatever the unit. Its response for "1 tablespoon olive oil" said 100 g and 800 calories, while listing a tablespoon of that food as 15 g. "1 cup all-purpose flour" came back as 100 g. "2 large eggs" came back as 200 g. We reproduced it in a fresh headless browser and a headed one with typed input. Lines we fixed through its editor got correct weights, which is why recipe 6, where 3 of 10 lines were hand-fixed, is the one recipe it nailed.
That explains the worst rows in the table. Recipe 16, a banana pudding, includes "32 vanilla wafers" and was booked as 32 times 100 g, for 1,481 calories per serving against 143 printed. Recipe 2 has "8 slices whole-wheat bread" counted as 800 g and "1 nonstick cooking spray" counted as 100 g of oil.
That bug may well be fixed by the time you read this. The lesson is not about one site: a calculator that does not show you the grams it assigned to each line is asking you to trust a step you cannot see.
The first job fails too, and ours does it as well. These are real lines from our misses:
- "2 cups assorted vegetables, chopped, such as mushrooms..." matched to a spray-style salad dressing, because "assorted" appears in the dressing's name. That one line counted 507 calories and 33 g of fat for the whole turkey meatloaf (recipe 9). A second slip, "99 percent lean" ground turkey matched to 93 percent lean, added more fat, and together they turned a printed 180 into 355.
- "3 3/4 cups cold, fat-free milk" matched to cold-pack American cheese food on the word "cold". Recipe 16 came back at 490 calories instead of 143.
- "14 ounces low-fat turkey kielbasa" matched to regular smoked kielbasa, so the "low-fat" in the line did nothing.
- "1/2 cinnamon stick" matched to stick margarine on the word "stick". In that run an AI helper step caught it. Without the helper the recipe would have come back at 342 calories instead of 232.
On the rival's side, lines it matched on its own without complaint included light mayonnaise matched to regular mayonnaise and "4 (6 1/2-inch) pitas" read as a 26-inch pita, which came to 865 calories.
Failure 2: sodium and the salt line
Sodium is where calculators disagree most, because three kinds of line swing it: the salt itself, broth, and anything canned.
- A teaspoon of table salt is 6 g and 2,325 mg of sodium. The Dietary Guidelines for Americans set the daily ceiling at 2,300 mg, so one wrong line can equal a whole day.
- Two cups of regular chicken broth is about 1,848 mg in the USDA data our tool uses. A "low-sodium" broth is a different food with a fraction of that.
- Canned beans, tomatoes and vegetables come in salted and no-salt-added versions, and a calculator that picks the wrong one changes sodium several-fold with almost no change in calories. Two of the misses below are 12x and 3.9x.
Printed against calculated, from the same run:
- Recipe 6, a pasta salad: 171 mg printed, 2,463 mg from Verywell Fit.
- Recipe 7, a potato salad: 212 mg printed, 2,409 mg from Verywell Fit. The cause was "1/2 teaspoon salt" booked as 50 g of salt.
- Recipe 13, a pasta primavera: 167 mg printed, 2,036 mg from RecipeClip. The cause was the "assorted vegetables" dressing match above, plus low-sodium tomato juice matched to the salted kind.
- Recipe 10, a shepherd's pie: 302 mg printed, 1,165 mg from RecipeClip, because "low-sodium chicken broth" matched the regular broth.
Sodium was within 25% of the printed value on 11 of 20 recipes for RecipeClip and 3 of 20 for Verywell Fit. Both tools were at least 2x too high on sodium on several recipes (5 for RecipeClip, 7 for Verywell Fit). Sodium is the number to check by hand if it matters to you.
Failure 3: what the panel cannot see
Some of the gap is not the calculator's fault. A nutrition panel describes the recipe as written, and a lot of cooking happens off the ingredient list.
- Raw versus cooked. One cup of uncooked long-grain white rice is 185 g and about 675 calories. One cup of cooked rice is 158 g and about 205 calories. Same word, "rice", a 3x difference, and a line that does not say which it is will be guessed.
- Fat left in the pan. If a recipe starts with 2 tablespoons of olive oil (239 calories) and a third of it stays behind, about 80 calories never reach the plate. Across four servings that is only 20 each, but with butter or ground meat the same effect is larger.
- Liquid you pour off. A marinade that gets discarded, a can of beans you drain, pasta water. We threw a marinated-chicken recipe out of the test set for exactly this reason, because the printed panel could not be reproduced from the ingredient list.
- Meat weighed before or after cooking. A pound of raw 80% lean ground beef is 1,152 calories in USDA data. How much of that fat ends up in the dish depends on how hard you drain it, and no ingredient list says.
- The servings count. If a recipe says "serves 4" and you eat what is really a third of the pot, every number moves by a third, whatever the calculator did.
None of these is an error. They are the reason a calculator's result should be treated as a good estimate and not a measurement.
Check any calculator's result in two minutes
- Read the per-ingredient breakdown, not just the total. If a tool hides it, treat the total as unchecked.
- Find the 2 or 3 calorie-dense lines: oil, butter, cheese, meat, nuts, sugar. Those carry most of the total. Confirm each one has a sensible food and a sensible weight. A tablespoon of oil is about 14 g and 119 calories. A cup of shredded cheddar is about 113 g.
- Look for a line with a weight that does not fit its unit. A teaspoon of anything booked at 50 g is a bug.
- Check the servings count against how you actually portion the dish.
- Check each "low-sodium", "no-salt-added", "fat-free" and "lean" line landed on that version of the food.
- Decide whether it matters. If the answer is a 10% error on dinner, you are done. If you are managing sodium, a medical diet or a tight budget of calories, weigh the ingredients and enter grams.
For weighing and scale conversions, our guides to converting recipes to metric and scaling a recipe cover the units. For reading labels on the ingredients themselves, see reading a nutrition label when you're the one cooking.
Where our calculator still misses
We are not going to pretend 13 of 20 is good enough.
- Three of our 20 results were more than 60% off on calories: recipes 9, 13 and 16, at +97%, +68% and +243%. Each came from a bad food match on a plain word, as described above. Someone watching fat on a low-fat plan would reject recipe 9's 355 calories, but would not know to from the number alone.
- Our matcher does not yet treat "low-sodium", "no-salt-added", "low-fat" and "99 percent lean" as firm requirements, which is behind most of the 5 recipes where our sodium came back at 2x the printed value or more.
- A stated weight in parentheses can lose to a volume. Recipe 6 listed "2 cups dry whole-wheat rotini (8 oz)", and we weighed it as 182 g instead of 227 g, which put us 20% low.
- The optional AI helper that resolves doubtful lines changed two recipes by more than 100 calories, one for the better and one for the worse. A rerun can move a score, and that is why we report one run.
- We use USDA's SR Legacy table, and the 2008 panels were analyzed with a different research database. Some differences are two correct databases disagreeing, not errors.
- Cooking losses and brand differences are not modeled, and we say so on the page.
The per-ingredient breakdown is how you catch these. That is the point of showing it.
Try the free nutrition calculator on your own recipe
Open the free recipe nutrition calculator, paste a recipe link or type the ingredients one per line, and set the servings. It needs no account. Each line shows the food it matched and the weight it used, with a note when the weight is a typical amount or the match is uncertain. You can pick a different food for a line or remove it, and the per-serving label recalculates. The help article on calculating nutrition for a recipe walks through each part of the result.
If a line looks wrong, fix that line. Two minutes spent on the three biggest lines will do more for the result than any choice of calculator.